
![[Image Credits]](https://miro.medium.com/max/2000/0*I9n_zwBI-RLZvzu2.png)
Table of Contents
Introduction
Welcome to another post on reproducibility in finance literature! In this post, we’ll discuss the reproduced results of the paper “Can ETFs be used to exploit country and industry momentum"1
Data
The data in this paper is mainly used from following sources:
- Kenneth French Data Library
- Center for Research in Security Prices (CRSP)
- Thomson Reuters Datastream
Results
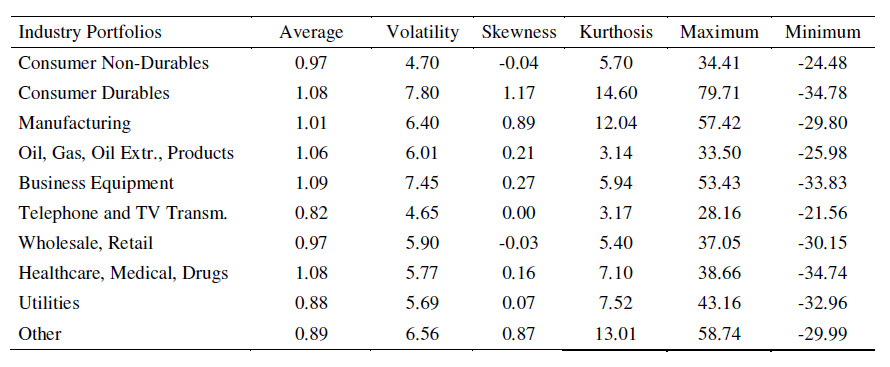
Table 1: Descriptive statistics industry portfolios 1926-2009
| Original Paper Table | Reproduced Table |
|---|---|
 |
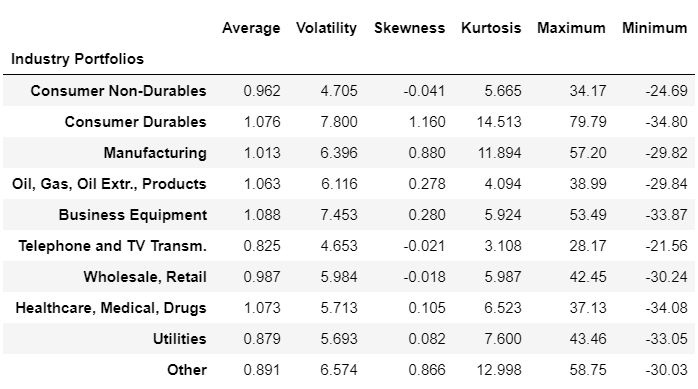 |
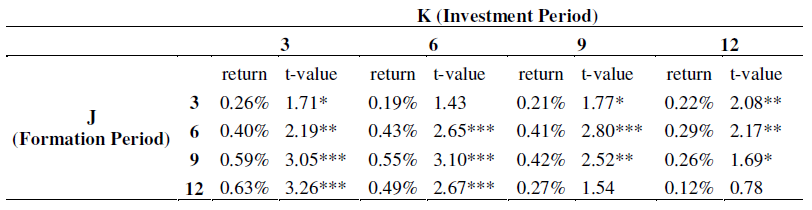
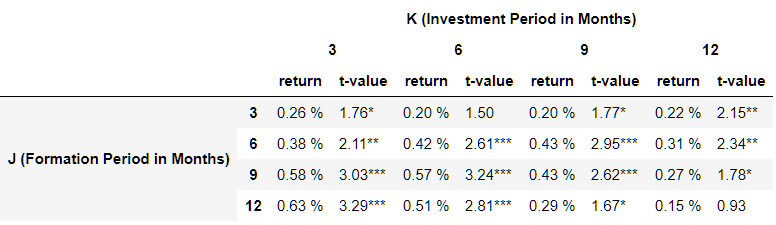
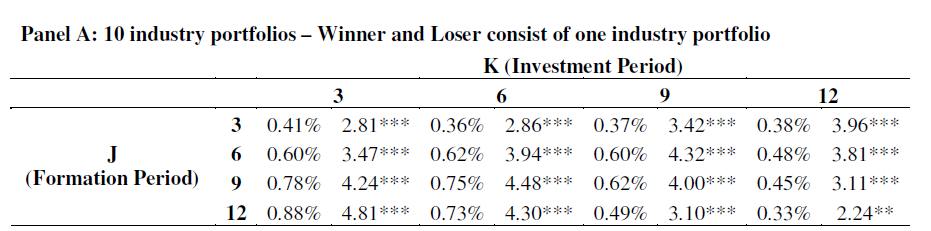
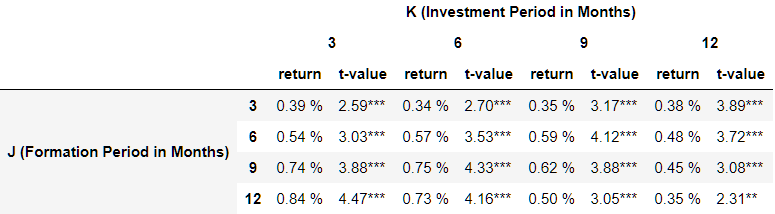
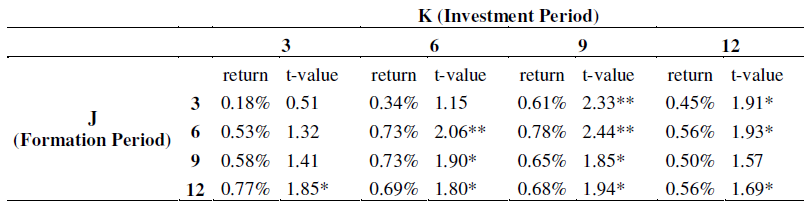
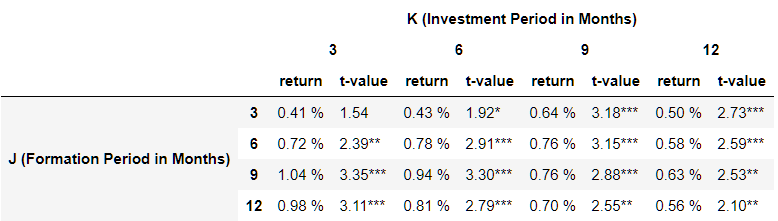
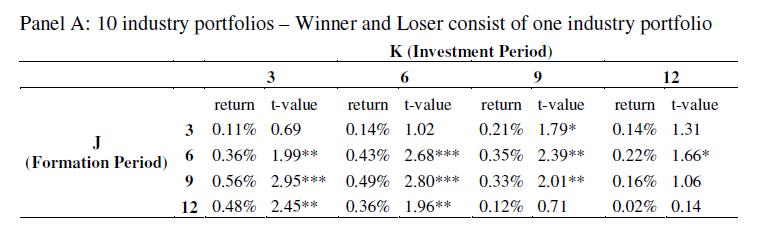
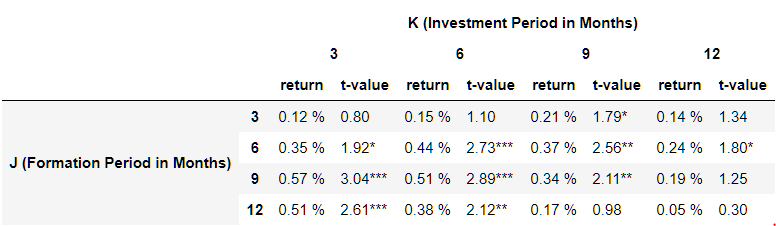
Table 2: Raw returns from industry momentum strategies 1926-2009
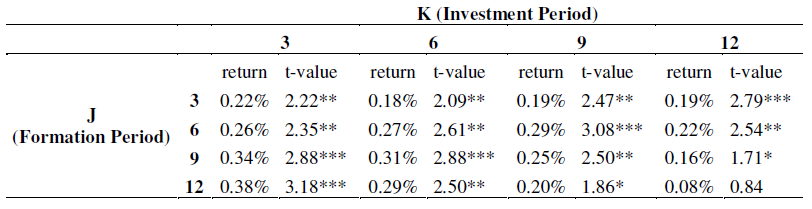
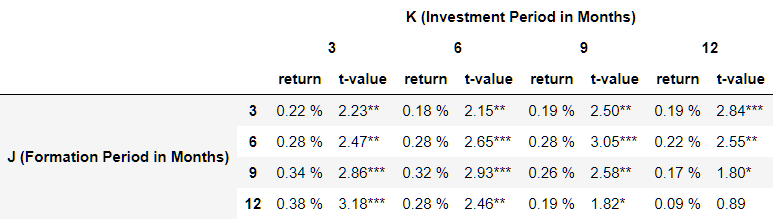
Panel A: 10 industry portfolios – Winner and Loser consist of one industry portfolio
| Original Paper Table | Reproduced Table |
|---|---|
 |
 |
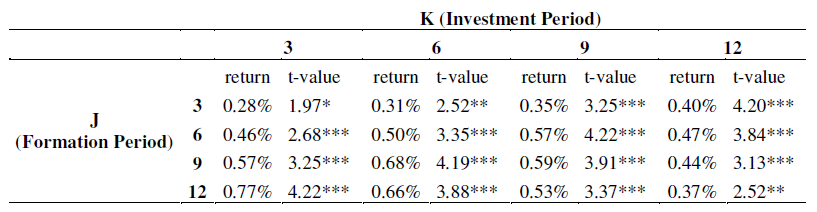
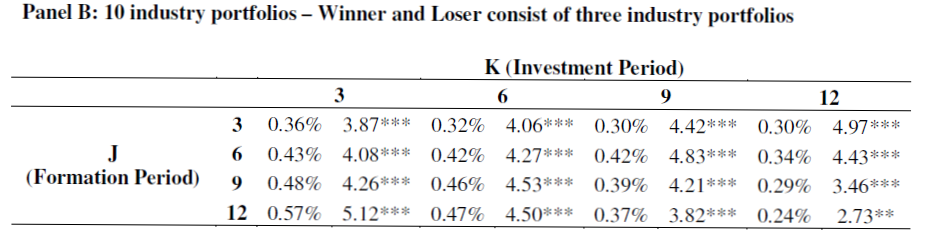
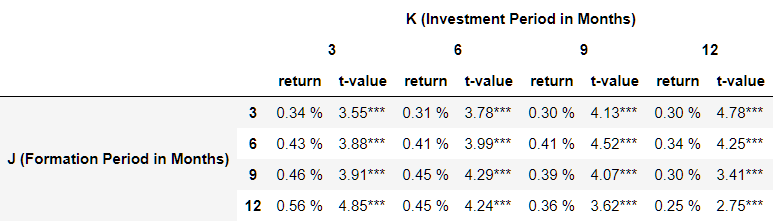
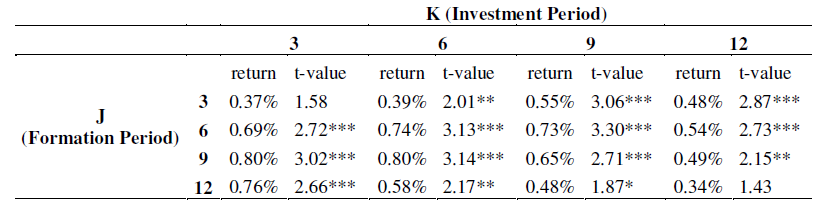
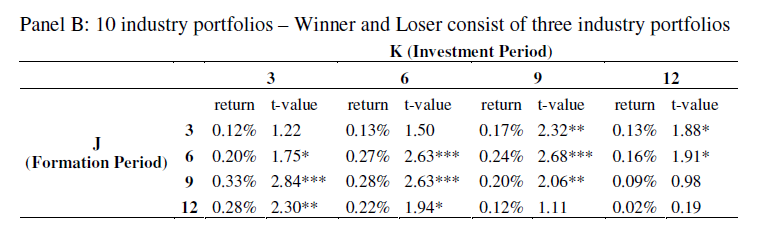
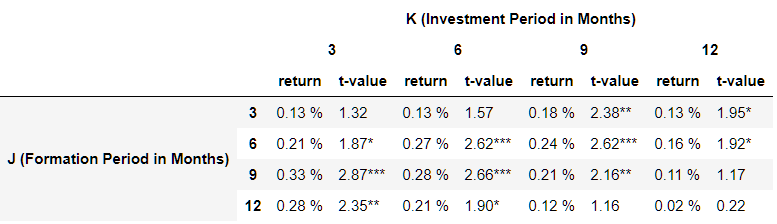
Panel B: 10 industry portfolios – Winner and Loser consist of three industry portfolios
| Original Paper Table | Reproduced Table |
|---|---|
 |
 |
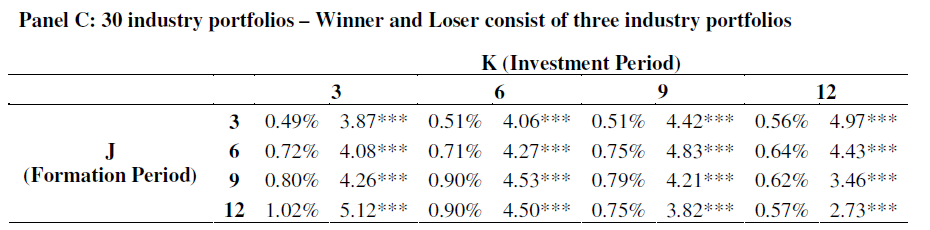
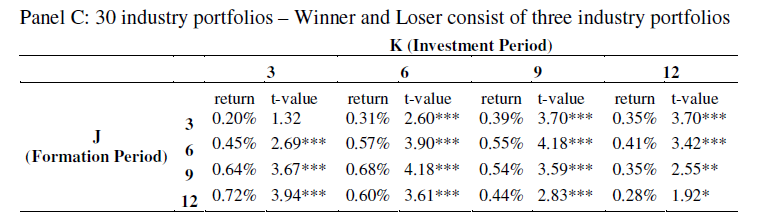
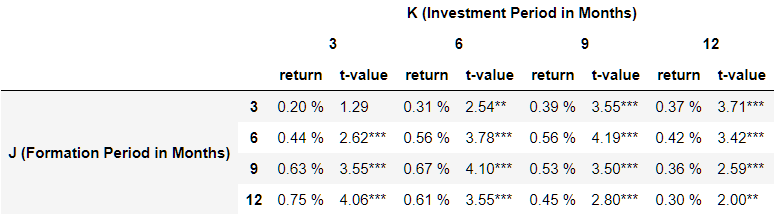
Panel C: 30 industry portfolios – Winner and Loser consist of three industry portfolios
| Original Paper Table | Reproduced Table |
|---|---|
 |
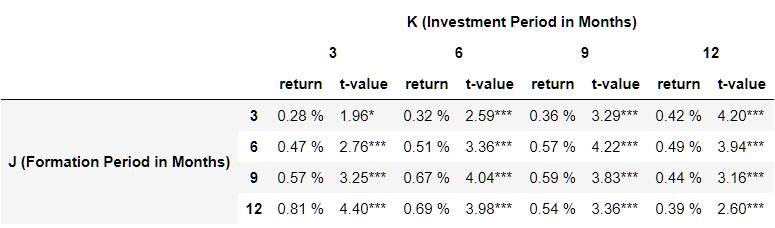 |
Table 3: Risk-adjusted returns from industry momentum strategies 1926-2009
Panel A: 10 industry portfolios – Winner and Loser consist of one industry portfolio
| Original Paper Table | Reproduced Table |
|---|---|
 |
 |
Panel B: 10 industry portfolios – Winner and Loser consist of three industry portfolios
| Original Paper Table | Reproduced Table |
|---|---|
 |
 |
Panel C: 30 industry portfolios – Winner and Loser consist of three industry portfolios
| Original Paper Table | Reproduced Table |
|---|---|
 |
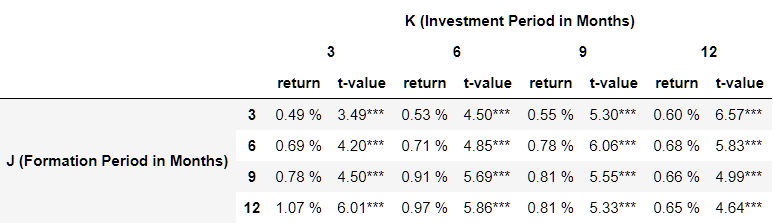 |
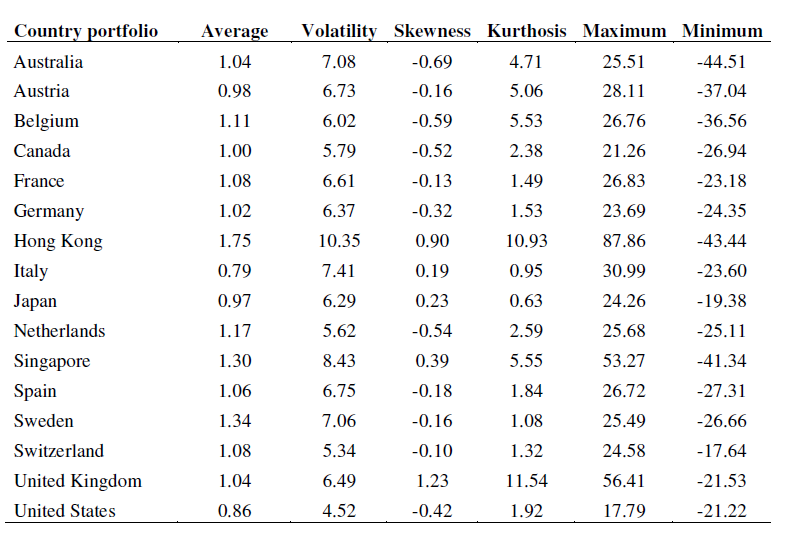
Table 4: Descriptive statistics country portfolios 1970-2009
| Original Paper Figure | Reproduced Figure |
|---|---|
 |
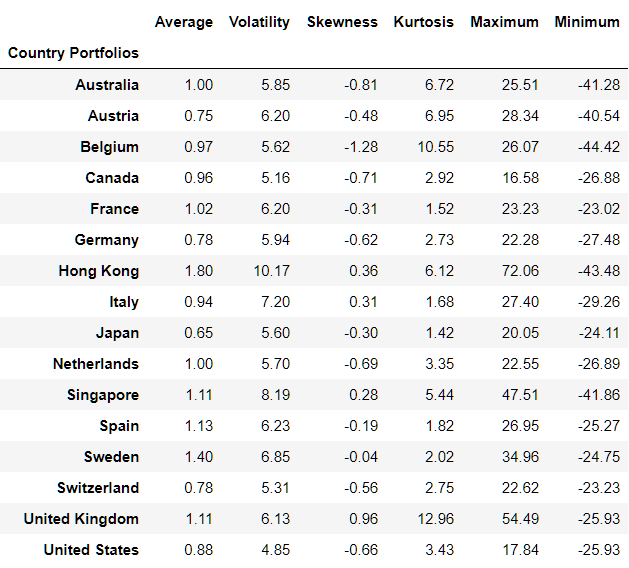 |
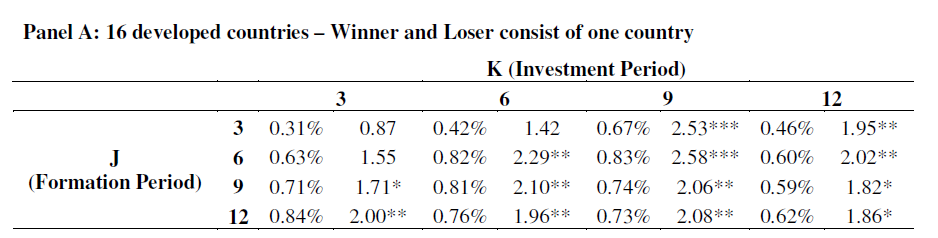
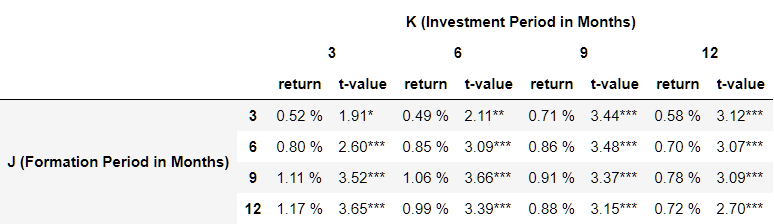
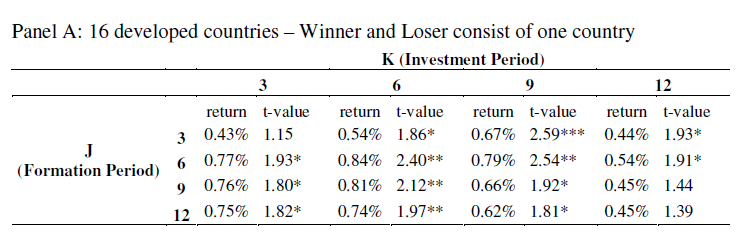
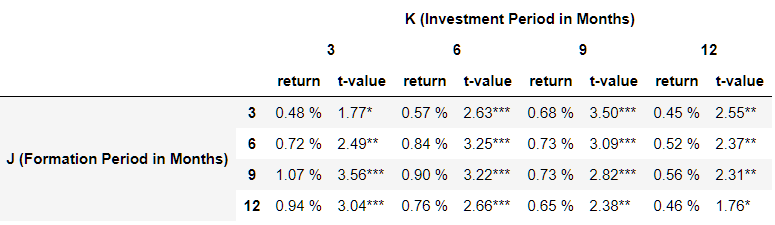
Table 5: Raw returns from country momentum strategies 1970-2009
Panel A: 16 developed countries – Winner and Loser consist of one country
| Original Paper Table | Reproduced Table |
|---|---|
 |
 |
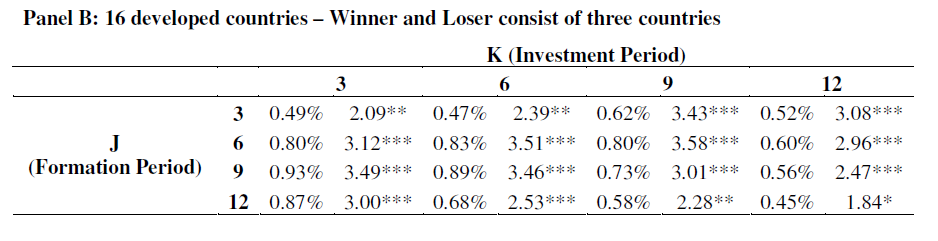
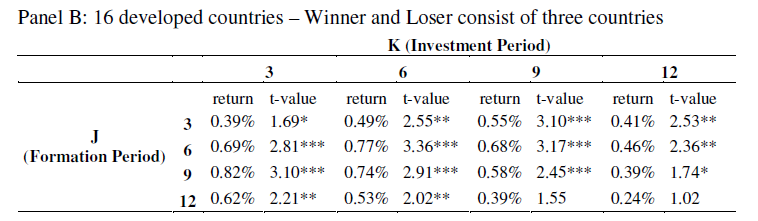
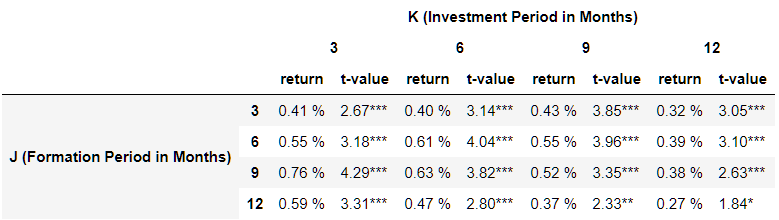
Panel B: 16 developed countries – Winner and Loser consist of three countries
| Original Paper Table | Reproduced Table |
|---|---|
 |
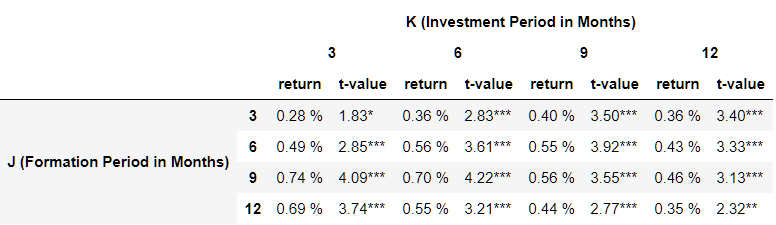 |
Table 6: Risk-adjusted returns from country momentum strategies 1970-2009
Panel A: 16 developed countries – Winner and Loser consist of one country
| Original Paper Table | Reproduced Table |
|---|---|
 |
 |
Panel B: 16 developed countries – Winner and Loser consist of three countries
| Original Paper Table | Reproduced Table |
|---|---|
 |
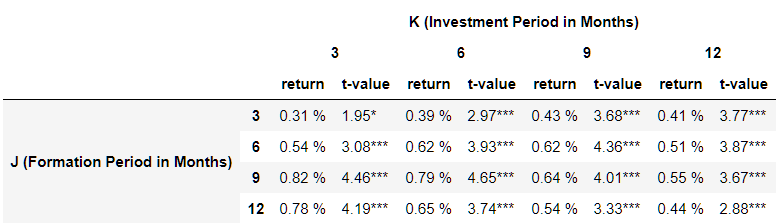 |
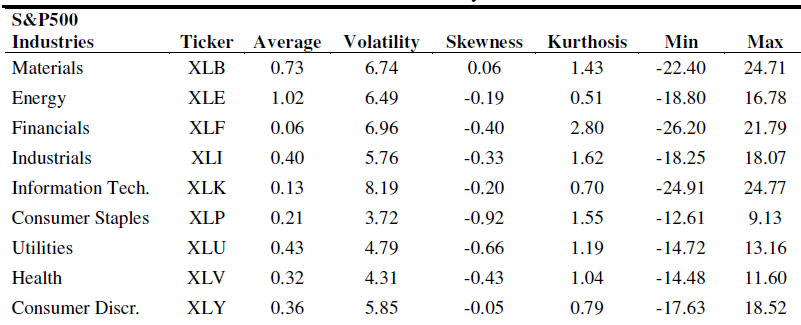
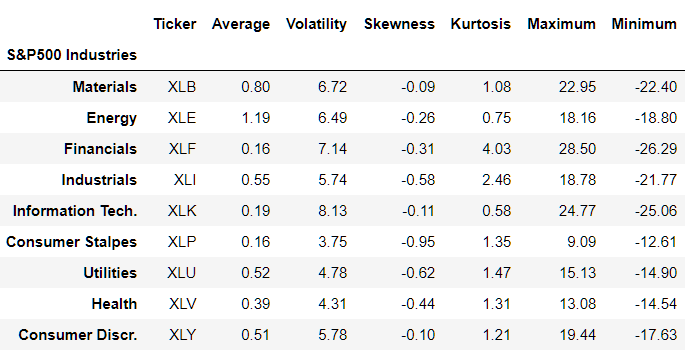
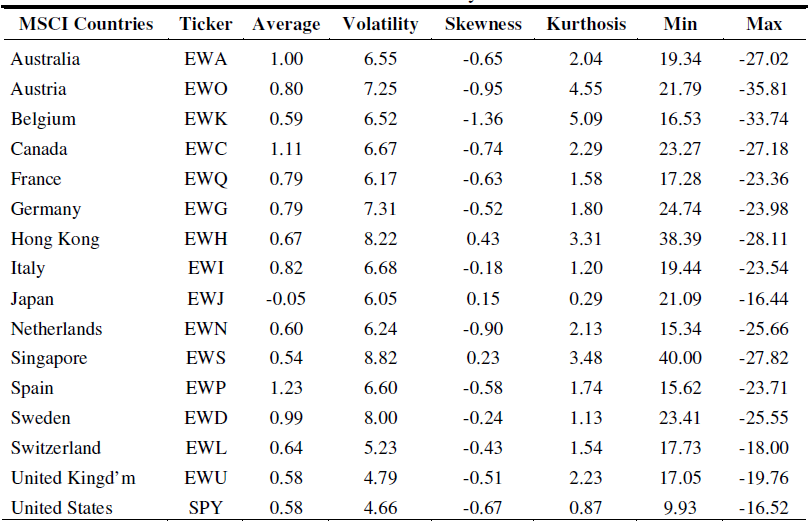
Table 7: Descriptive Statistics ETF returns
Panel A: Industry ETFs
| Original Paper Table | Reproduced Table |
|---|---|
 |
 |
Panel B: Country ETFs
| Original Paper Table | Reproduced Table |
|---|---|
 |
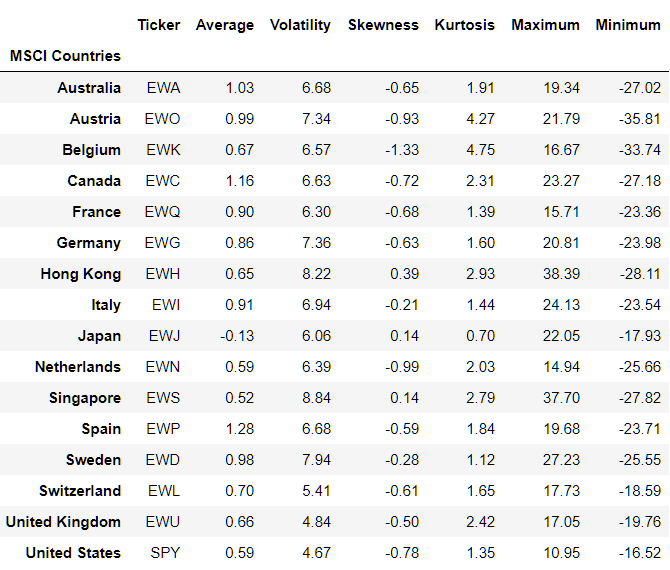 |
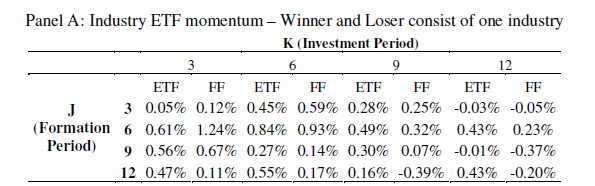
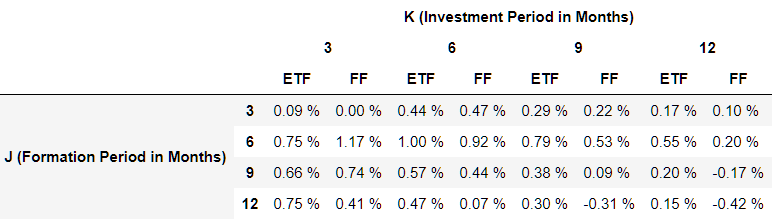
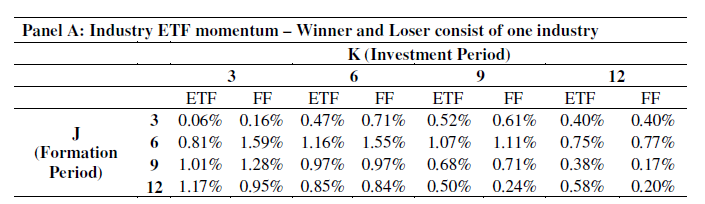
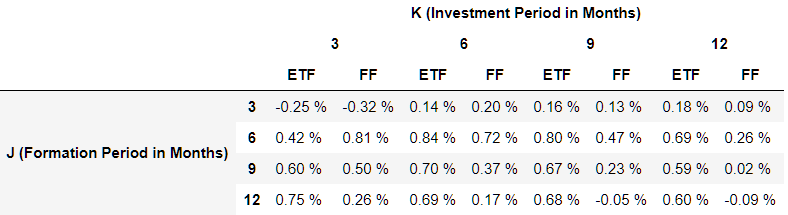
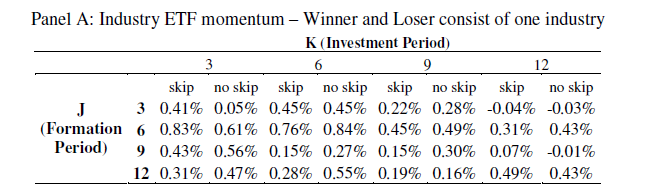
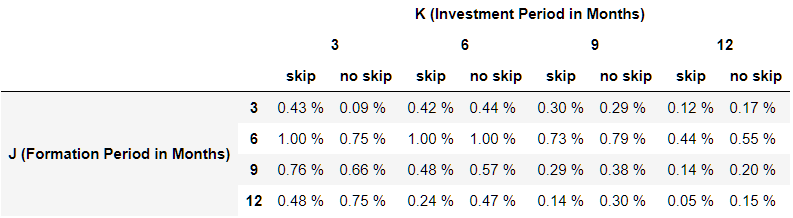
Table 8: Raw returns from momentum Strategies using ETFs
Panel A: Industry ETF momentum – Winner and Loser consist of one industry
| Original Paper Table | Reproduced Table |
|---|---|
 |
 |
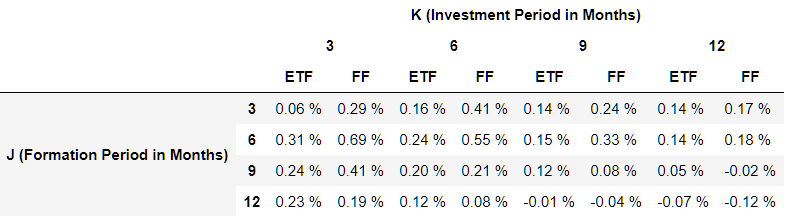
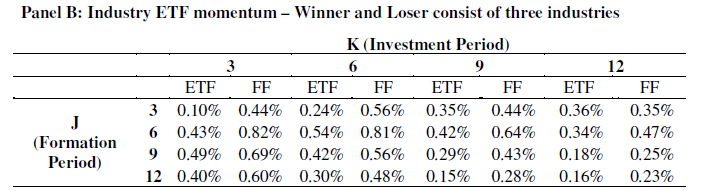
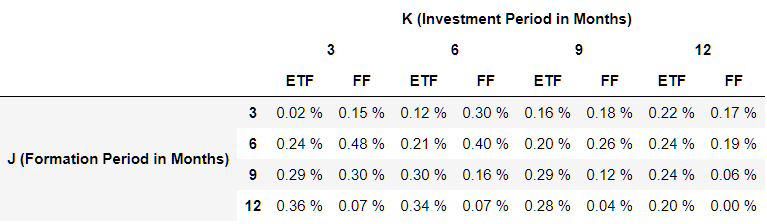
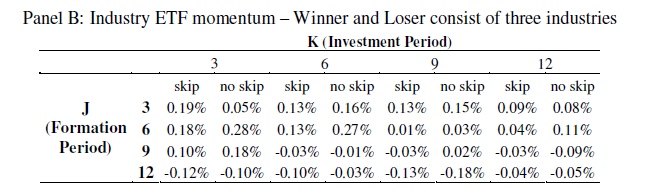
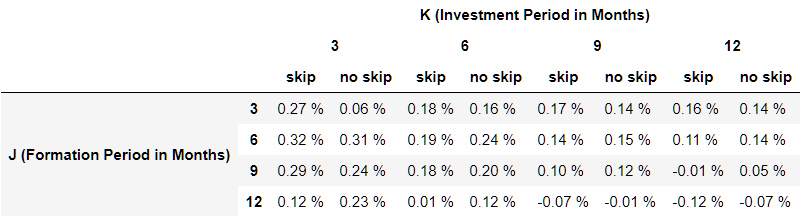
Panel B: Industry ETF momentum – Winner and Loser consist of three industries
| Original Paper Table | Reproduced Table |
|---|---|
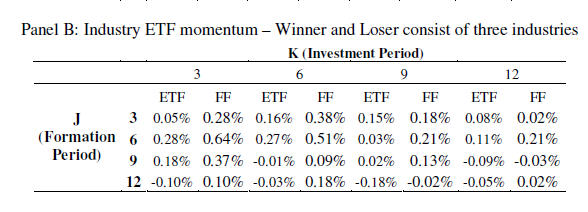 |
 |
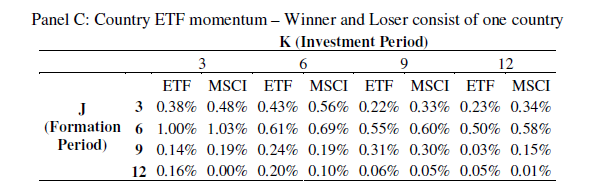
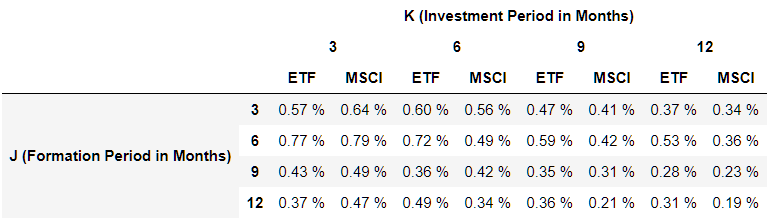
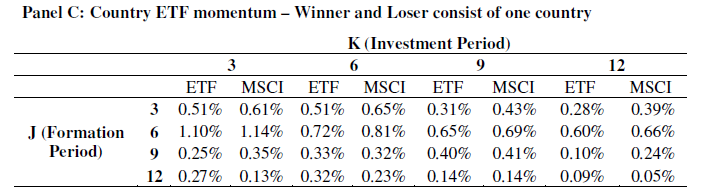
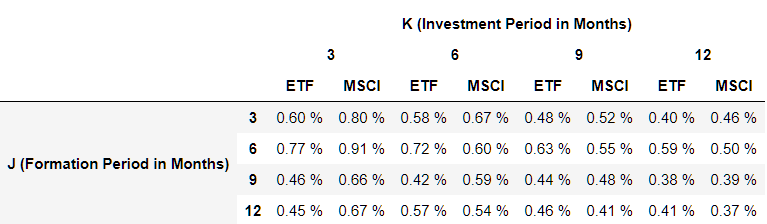
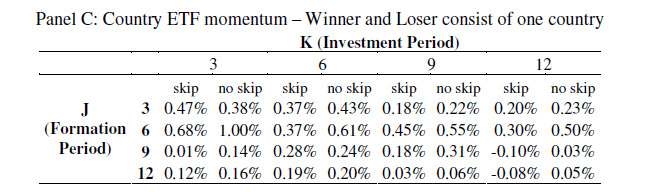
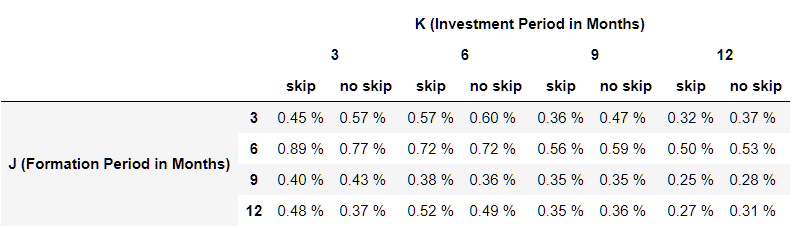
Panel C: Country ETF momentum – Winner and Loser consist of one country
| Original Paper Table | Reproduced Table |
|---|---|
 |
 |
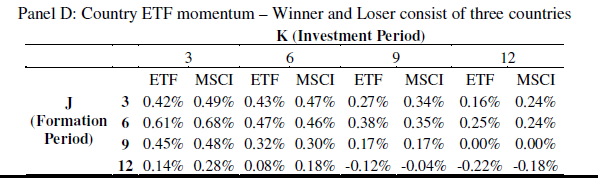
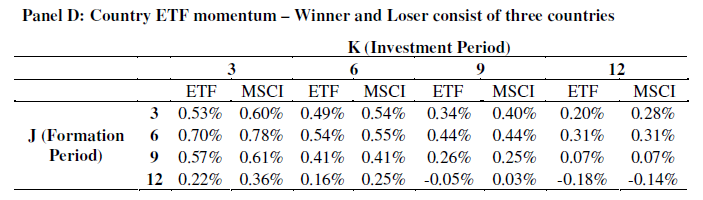
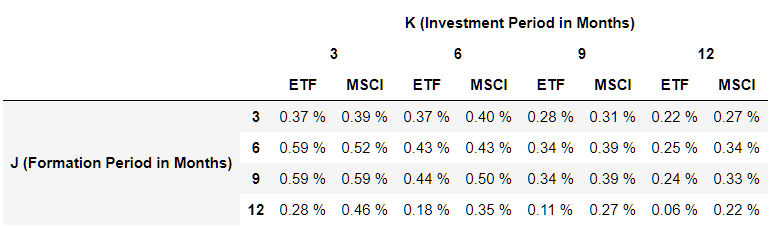
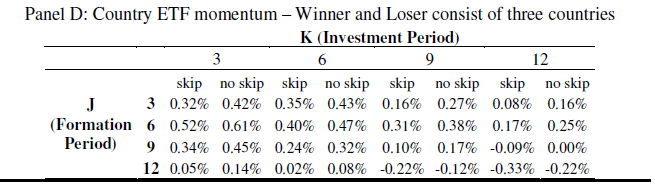
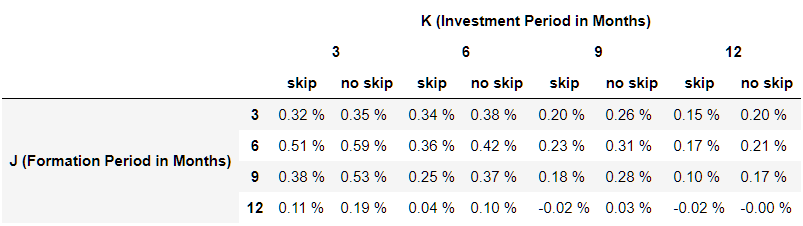
Panel D: Country ETF momentum – Winner and Loser consist of three countries
| Original Paper Table | Reproduced Table |
|---|---|
 |
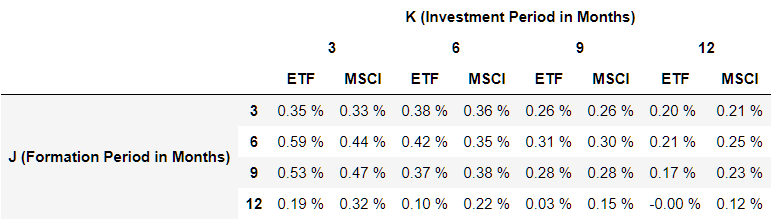 |
Table 9: Risk-adjusted returns from momentum Strategies using ETFs
Panel A: Industry ETF momentum – Winner and Loser consist of one industry
| Original Paper Table | Reproduced Table |
|---|---|
 |
 |
Panel B: Industry ETF momentum – Winner and Loser consist of three industries
| Original Paper Table | Reproduced Table |
|---|---|
 |
 |
Panel C: Country ETF momentum – Winner and Loser consist of one country
| Original Paper Table | Reproduced Table |
|---|---|
 |
 |
Panel D: Country ETF momentum – Winner and Loser consist of three countries
| Original Paper Table | Reproduced Table |
|---|---|
 |
 |
Appendix Table A1: Industry momentum strategies 1926-2009: one-month skip
Panel A: 10 industry portfolios – Winner and Loser consist of one industry portfolio
| Original Paper Table | Reproduced Table |
|---|---|
 |
 |
Panel B: 10 industry portfolios – Winner and Loser consist of three industry portfolios
| Original Paper Table | Reproduced Table |
|---|---|
 |
 |
Panel C: 30 industry portfolios – Winner and Loser consist of three industry portfolios
| Original Paper Table | Reproduced Table |
|---|---|
 |
 |
Appendix Table A2: Country momentum strategies 1970-2009: one month skip
Panel A: 16 developed countries – Winner and Loser consist of one country
| Original Paper Table | Reproduced Table |
|---|---|
 |
 |
Panel B: 16 developed countries – Winner and Loser consist of three countries
| Original Paper Table | Reproduced Table |
|---|---|
 |
 |
Appendix Table A3: Momentum Strategies using ETFs: one-month skip
Panel A: Industry ETF momentum – Winner and Loser consist of one industry
| Original Paper Table | Reproduced Table |
|---|---|
 |
 |
Panel B: Industry ETF momentum – Winner and Loser consist of three industries
| Original Paper Table | Reproduced Table |
|---|---|
 |
 |
Panel C: Country ETF momentum – Winner and Loser consist of one country
| Original Paper Table | Reproduced Table |
|---|---|
 |
 |
Panel D: Country ETF momentum – Winner and Loser consist of three countries
| Original Paper Table | Reproduced Table |
|---|---|
 |
 |
References
-
Andreu, Laura and Swinkels, Laurens and Tjong-A-Tjoe, Liam, Can Exchange Traded Funds be Used to Exploit Country and Industry Momentum? (August 2012). Financial Markets and Portfolio Management, Forthcoming, Available at SSRN: https://ssrn.com/abstract=1150972 or http://dx.doi.org/10.2139/ssrn.1150972 ↩︎