Introduction
Welcome to another post on reproducibility in finance literature!
Last year, Pim van Vliet from Robeco‘s quant team tweeted a new research study (joint work with David Blitz and Guido Baltussen) – “When equity factors drop their shorts"1 – investigating the common equity factors from the perspectives of long and short leg separately and assessing each leg’s contribution to the overall performance of the portfolio.
NEW STUDY | Curious to know what happens ‘when equity factors drop their shorts’? Here you go quants!👇 https://t.co/LRranuQzX3
— Pim van Vliet (@paradoxinvestor) November 27, 2019
I was quite intrigued with the title of the paper, so decided to spend some time reading and then reproducing the results of the paper using Python 🐍 and better understand the methodology followed by the authors. All the code is available on Github.
⚠️ The purpose of this post is just to confirm the reproducibility of the research. Paper is already well summarized in the below links.
Nice discussion of paper ‘when Equity factors drop their shorts’ by @larryswedroe https://t.co/GHZKaacxuv
— Pim van Vliet (@paradoxinvestor) December 10, 2019
Do short legs add value? Summary👇 https://t.co/XUScvLg9Mq
— Pim van Vliet (@paradoxinvestor) December 16, 2019
Data
Most of the data used in the paper is sourced from Kenneth French Data Library. I’d like to thank Matthias Hanauer for assisting with data on 2x3 size-volatility sorted factor portfolios for US and ex-US (global) markets based on his paper “Enhanced Momentum Strategies"2
Results
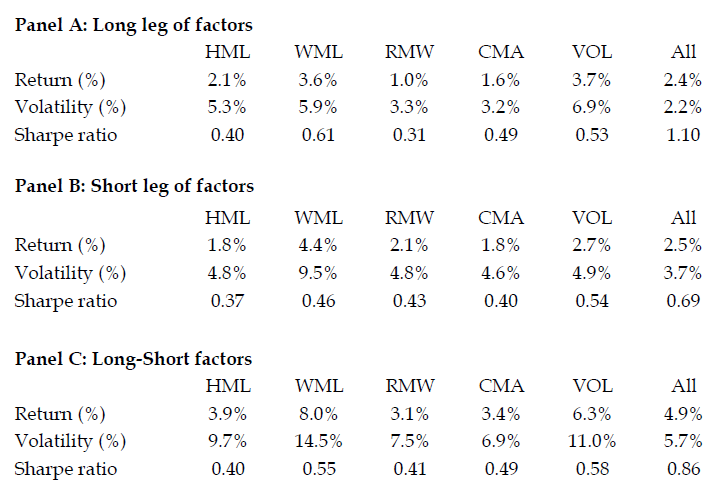
Table 1: Breakdown of factor premiums
| Original Paper Table | Reproduced Table |
|---|---|
 |
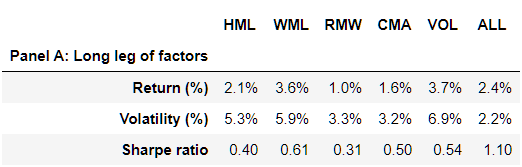 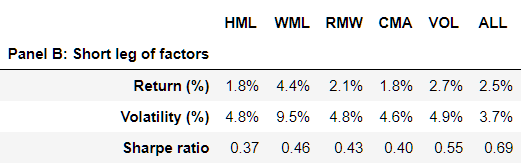 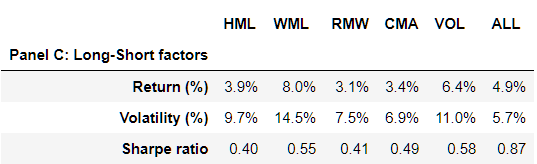 |
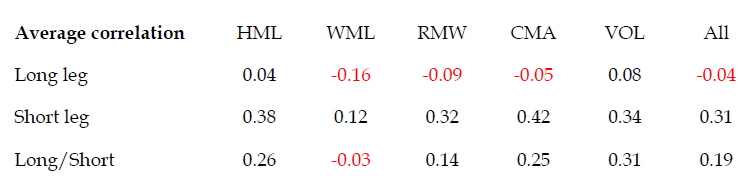
Table 2: Diversification benefits of factors
| Original Paper Table | Reproduced Table |
|---|---|
 |
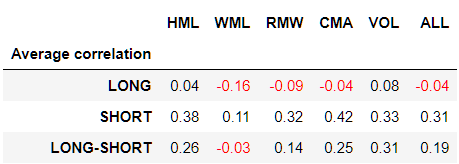 |
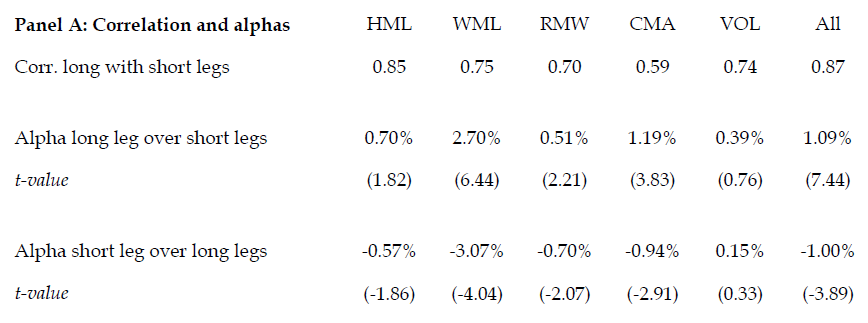
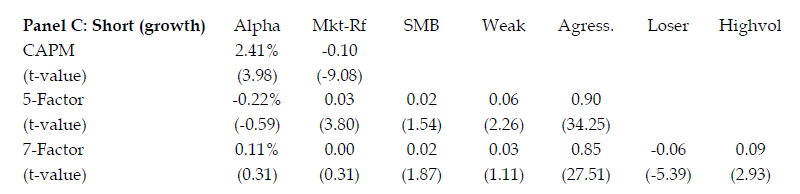
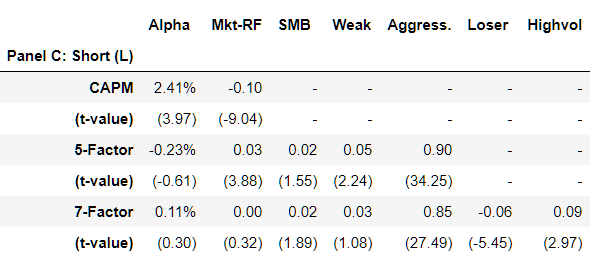
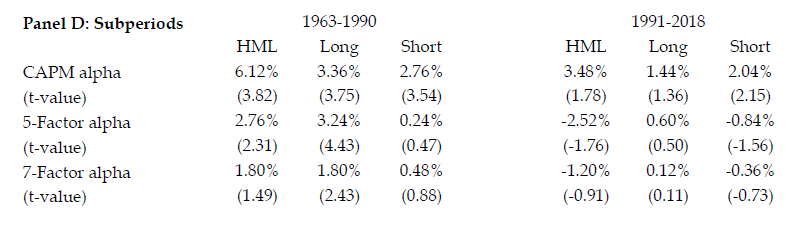
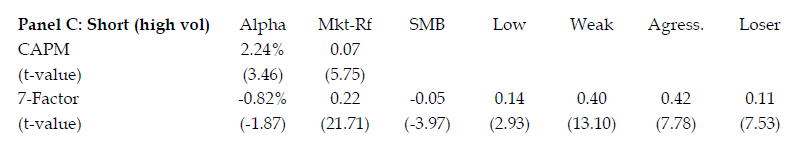
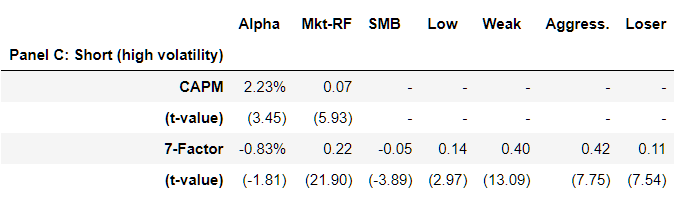
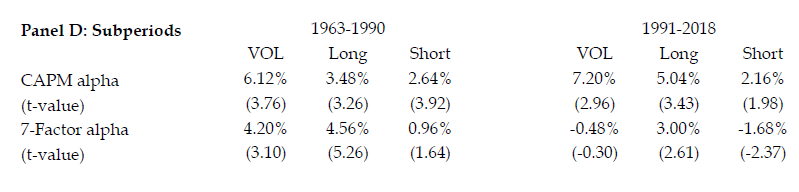
Table 3: Added value long- and short-legs
| Original Paper Table | Reproduced Table |
|---|---|
 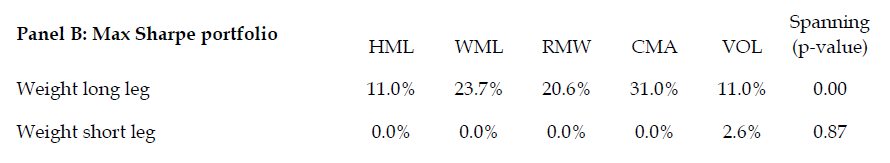 |
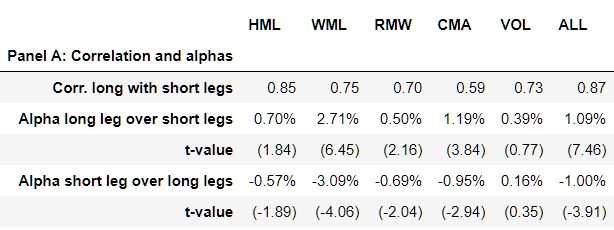 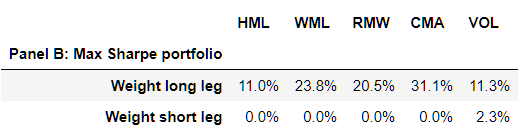 |
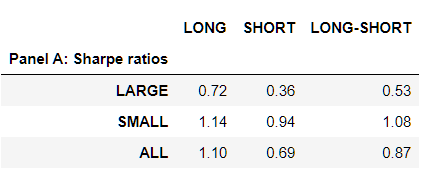
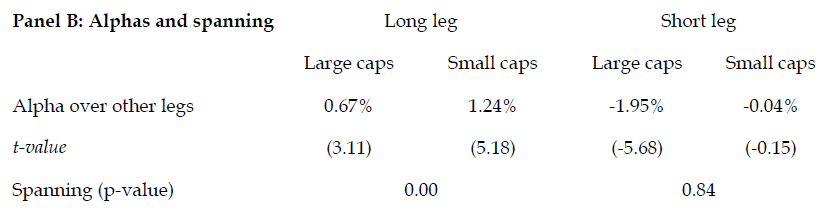
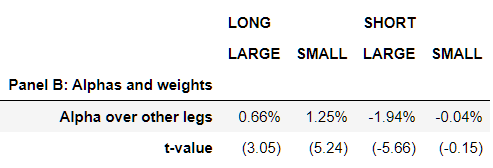
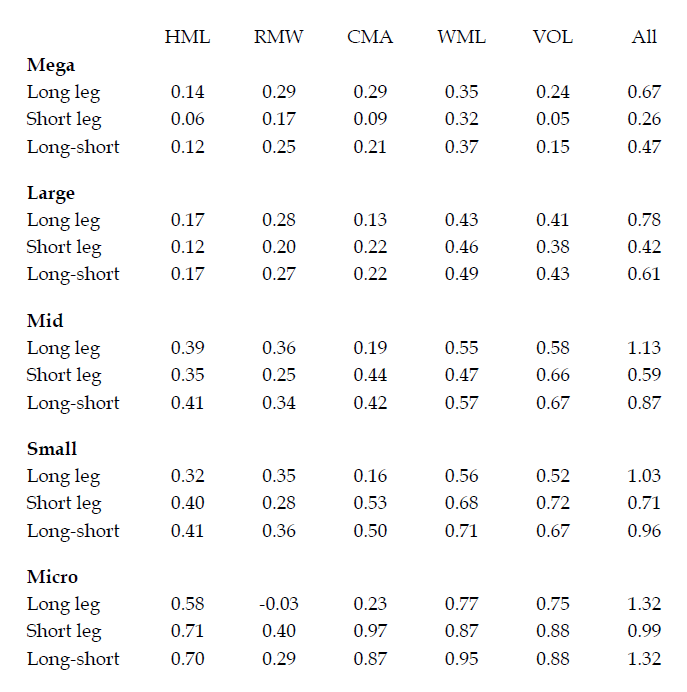
Table 4: Small versus large caps
| Original Paper Table | Reproduced Table |
|---|---|
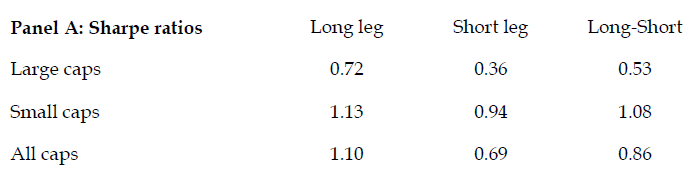 |
 |
| Original Paper Table | Reproduced Table |
|---|---|
 |
 |
| Original Paper Table | Reproduced Table |
|---|---|
 |
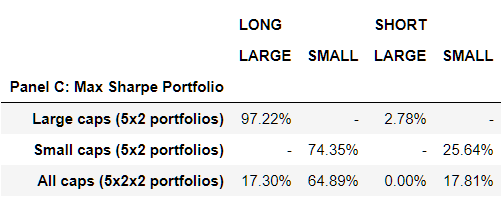 |
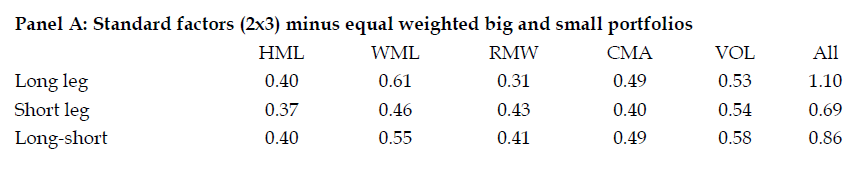
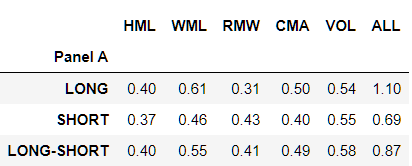
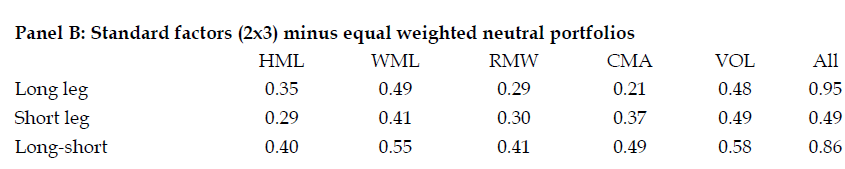
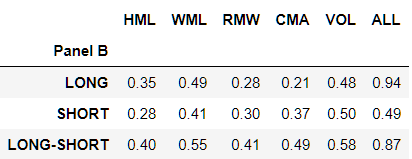
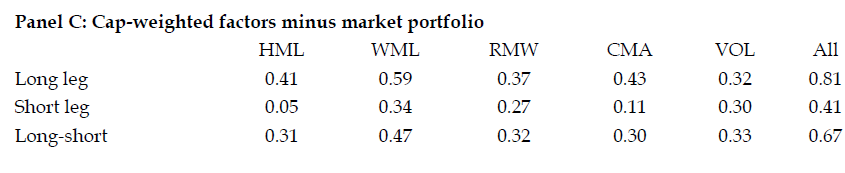
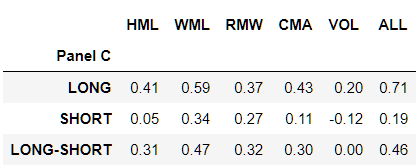
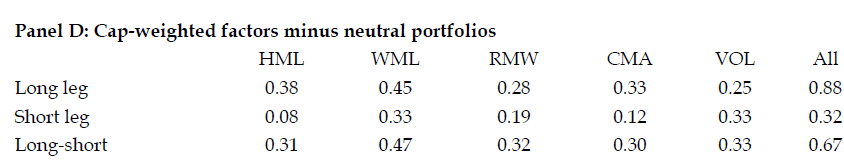
Table 5: Robustness to definition of factor legs
Note: In Panel C and Panel D, for the VOL factor, paper uses cap-weighted version, while I have used equal-weighted version. Hence the discrepancy in the results for VOL factor and All (i.e. combined factor) results.
| Original Paper Table | Reproduced Table |
|---|---|
 |
 |
| Original Paper Table | Reproduced Table |
|---|---|
 |
 |
| Original Paper Table | Reproduced Table |
|---|---|
 |
 |
| Original Paper Table | Reproduced Table |
|---|---|
 |
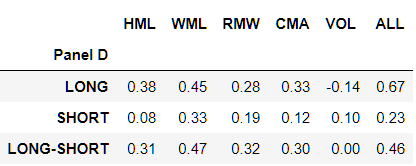 |
Table 6: Long versus short legs based on 5x5 portfolios
Note: Since I do not have access to 5x5 size volatility factor portfolios used by the authors, a similar risk metric of 5x5 size/risk sorted portfolios is used from the Kenneth French data library. Hence the discrepancy in the VOL factor and All (i.e. combined factor) results.
| Original Paper Table | Reproduced Table |
|---|---|
 |
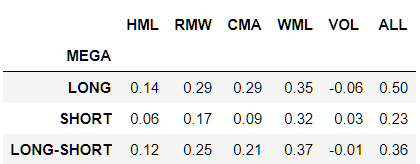 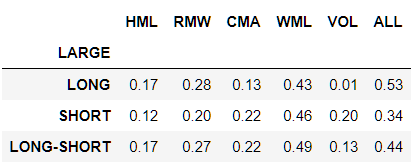 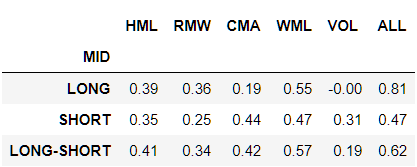 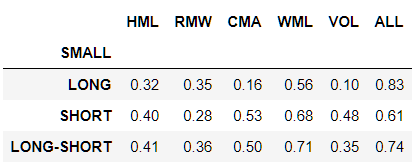 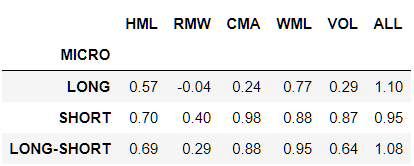 |
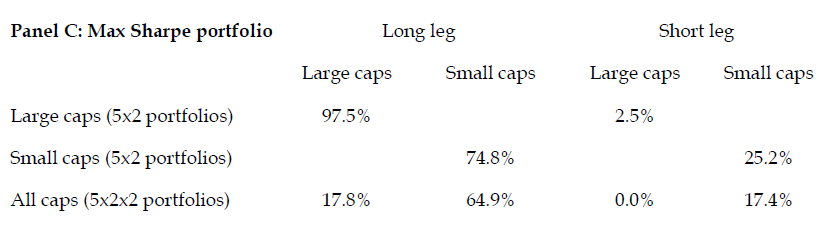
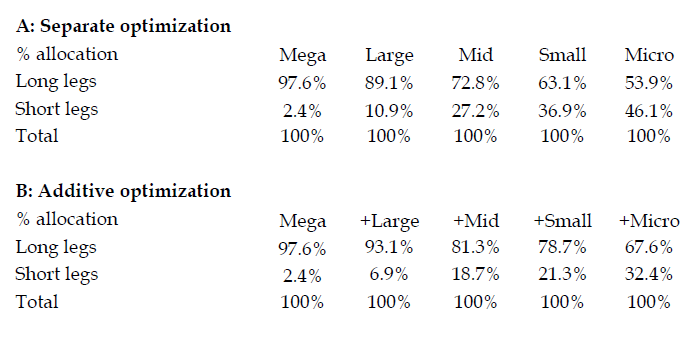
Table 7: Portfolio optimization results for 5x5 portfolios
Note: This table utilizes the same data used in Table 6. Due to different data source for 5x5 size-volatility factor portfolios (VOL), the below results on maximum sharpe ratio optimization are not exactly the same as mentioned in the paper. However, the conclusions remain indifferent (i.e. major allocation is for the long leg of factors across different sizes) in both separate and additive optimization.
| Original Paper Table | Reproduced Table |
|---|---|
 |
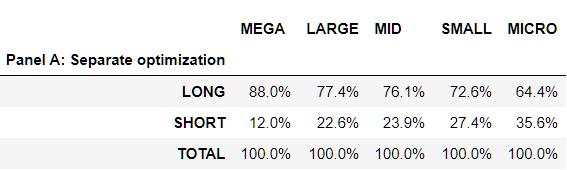 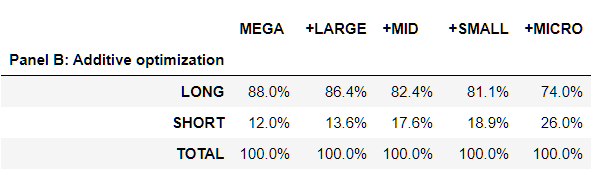 |
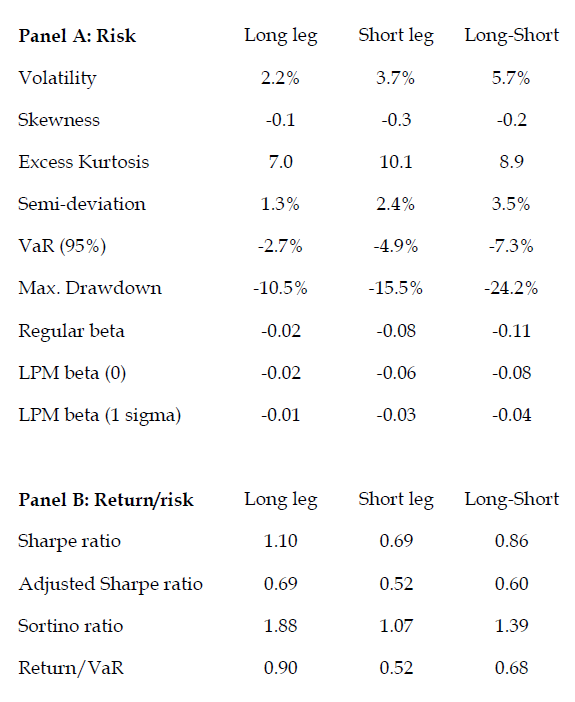
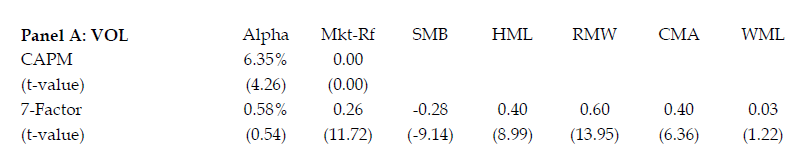
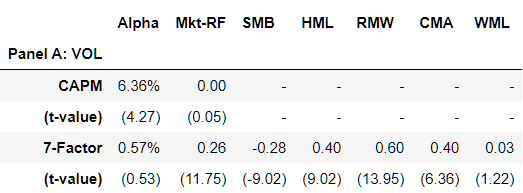
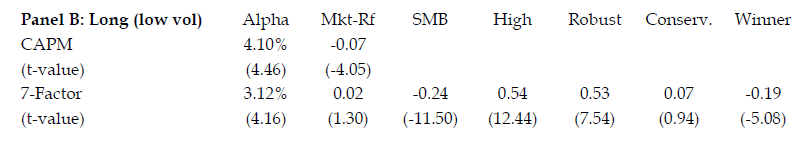
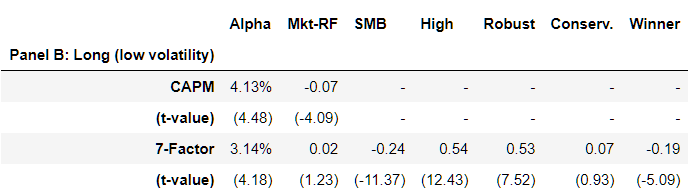
Table 8: Volatility and long versus short legs
| Original Paper Table | Reproduced Table |
|---|---|
 |
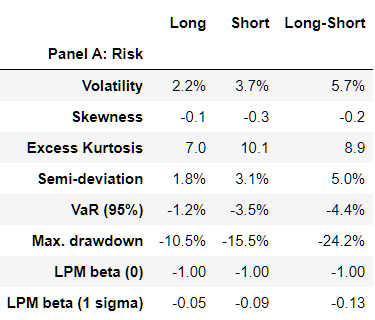  |
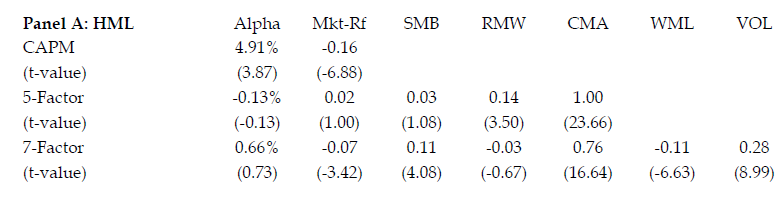
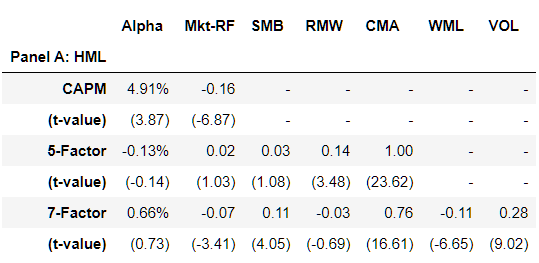
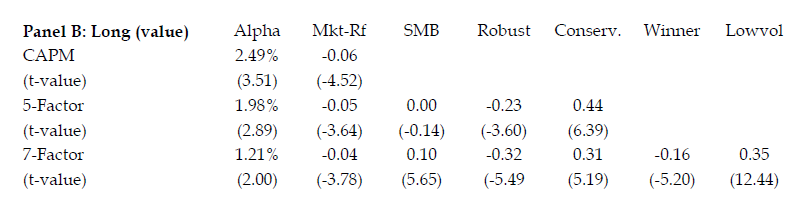
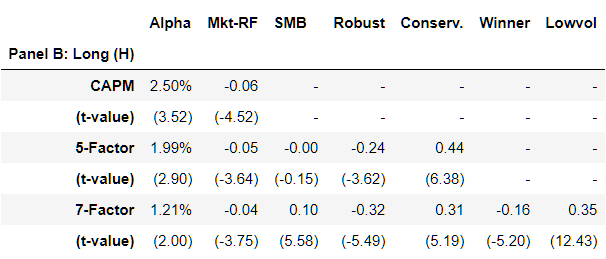
Table 10: HML and long versus short legs
| Original Paper Table | Reproduced Table |
|---|---|
 |
 |
| Original Paper Table | Reproduced Table |
|---|---|
 |
 |
| Original Paper Table | Reproduced Table |
|---|---|
 |
 |
| Original Paper Table | Reproduced Table |
|---|---|
 |
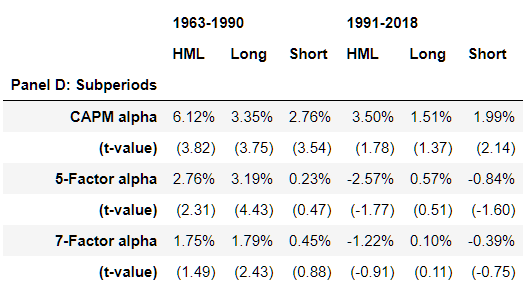 |
Table 11: Volatility and long versus short legs
| Original Paper Table | Reproduced Table |
|---|---|
 |
 |
| Original Paper Table | Reproduced Table |
|---|---|
 |
 |
| Original Paper Table | Reproduced Table |
|---|---|
 |
 |
| Original Paper Table | Reproduced Table |
|---|---|
 |
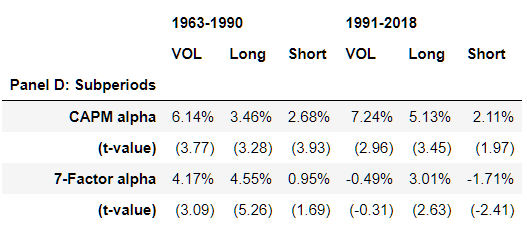 |
Figure 2: The long and short of equity factors
| Original Paper Figure | Reproduced Figure |
|---|---|
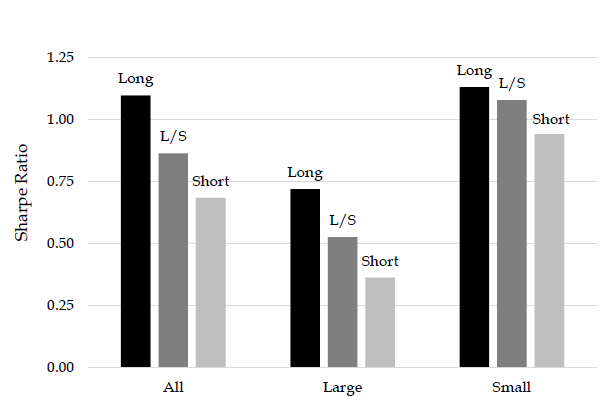 |
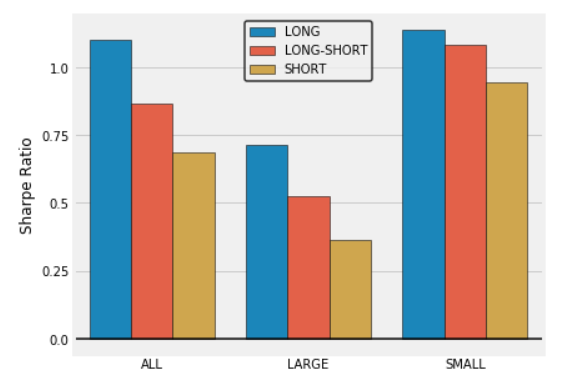 |
Figure 3: Diversification benefit of equity factors
| Original Paper Figure | Reproduced Figure |
|---|---|
 |
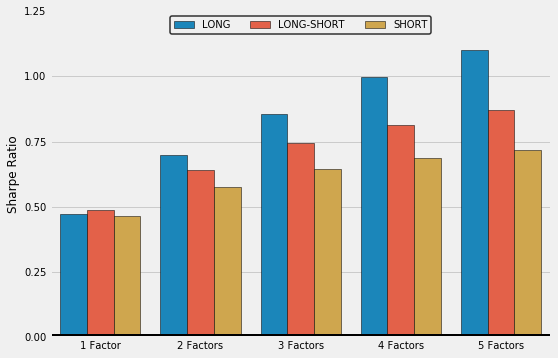 |
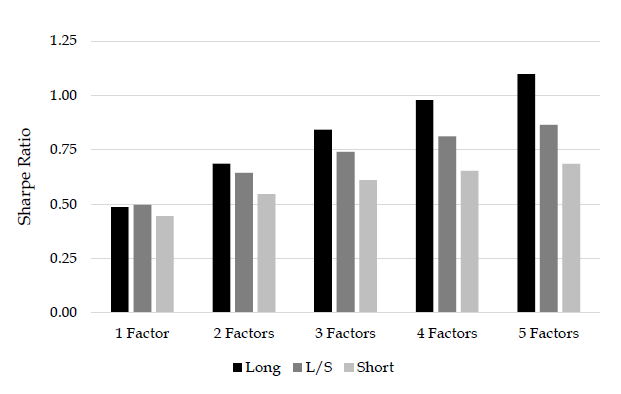
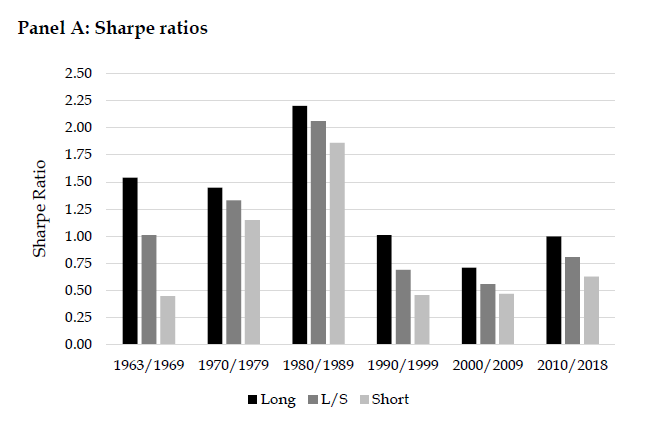
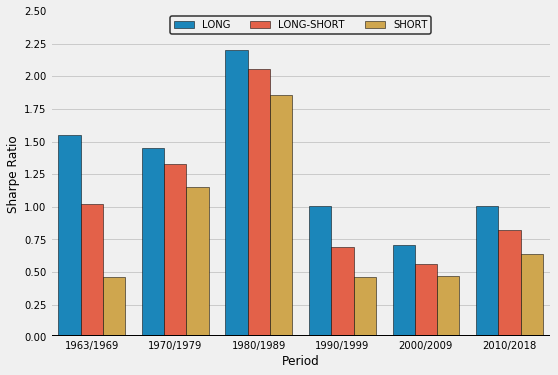
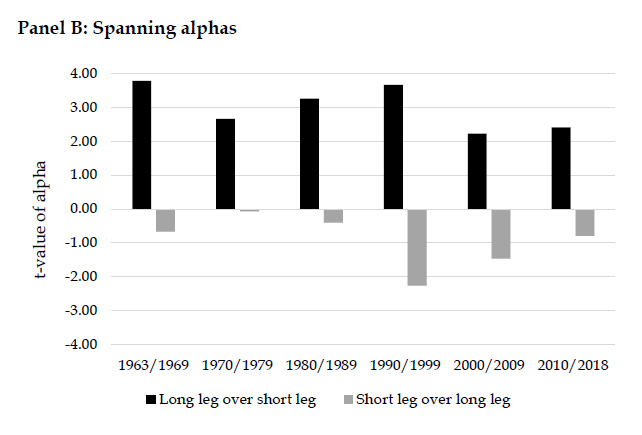
Figure 4: Subperiod results
| Original Paper Figure | Reproduced Figure |
|---|---|
 |
 |
| Original Paper Figure | Reproduced Figure |
|---|---|
 |
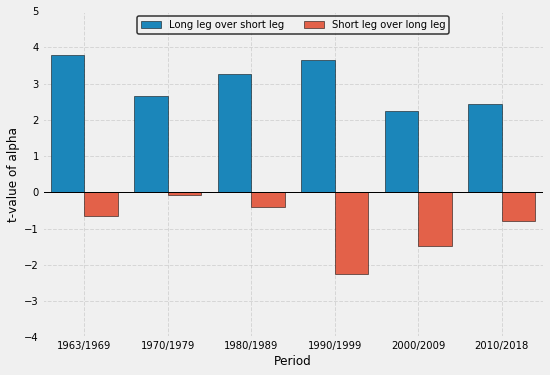 |
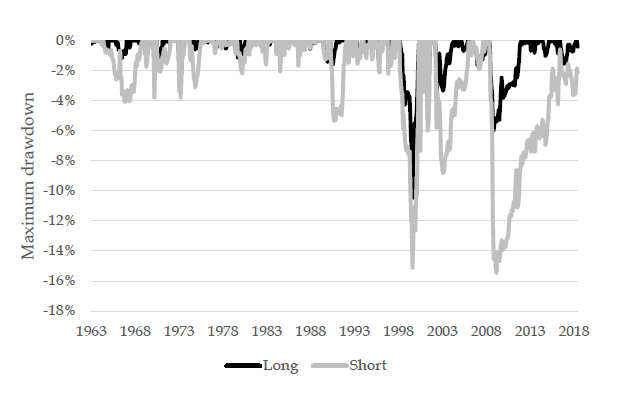
Figure 5: Drawdowns of factor portfolios
| Original Paper Figure | Reproduced Figure |
|---|---|
 |
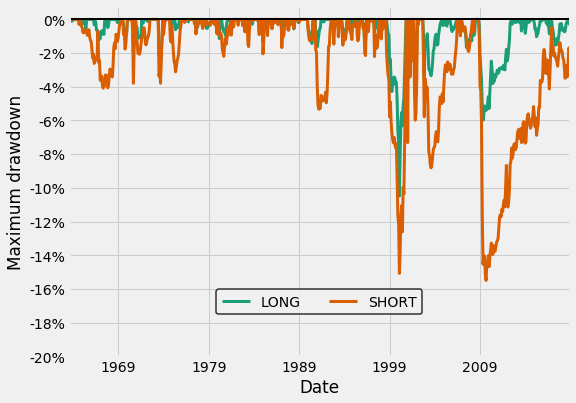 |
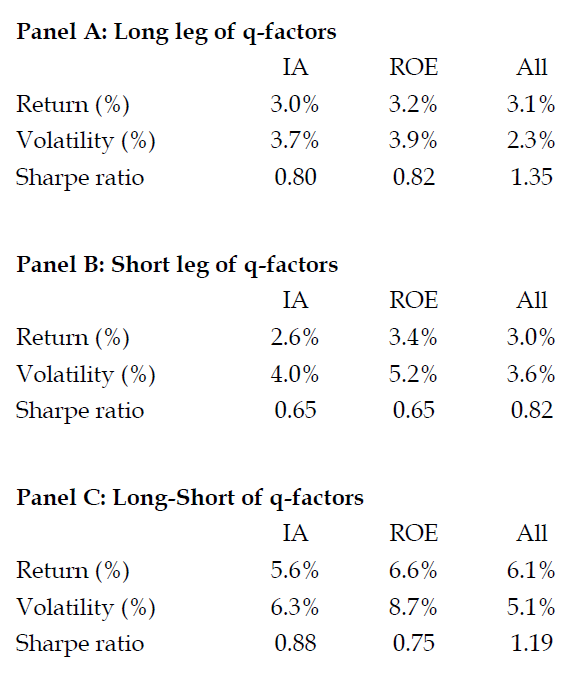
Table A1: Breakdown of q-factor premiums
| Original Paper Table | Reproduced Table |
|---|---|
 |
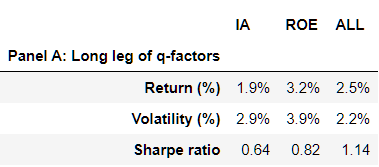 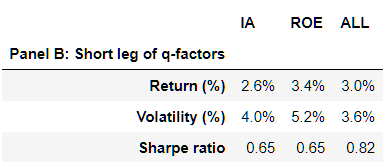 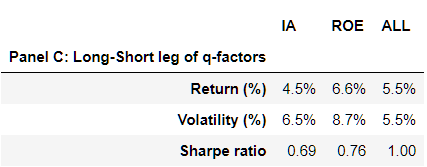 |
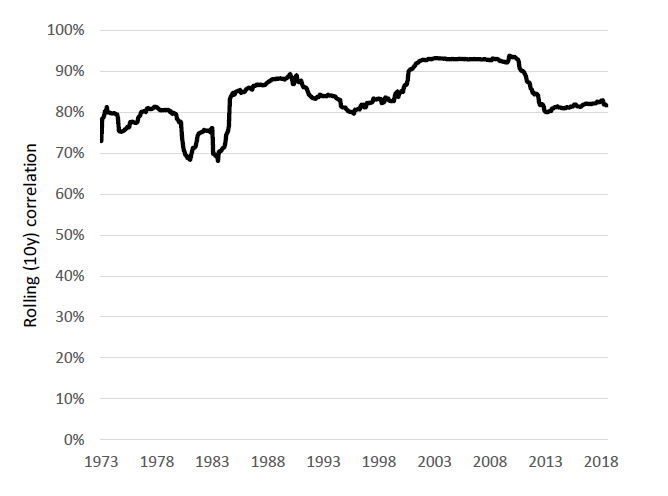
Figure A1: Rolling (10-year) correlation between long leg and short leg
| Original Paper Figure | Reproduced Figure |
|---|---|
 |
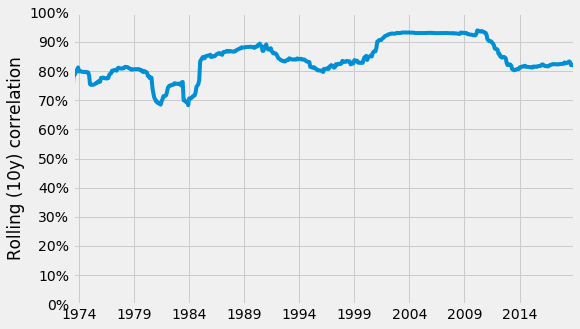 |
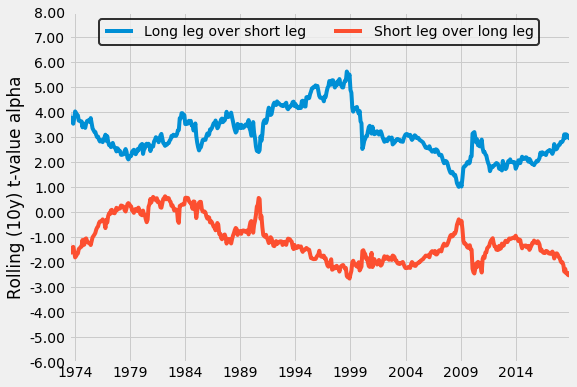
Figure A2: Rolling (10-year) alpha of long versus short legs
| Original Paper Figure | Reproduced Figure |
|---|---|
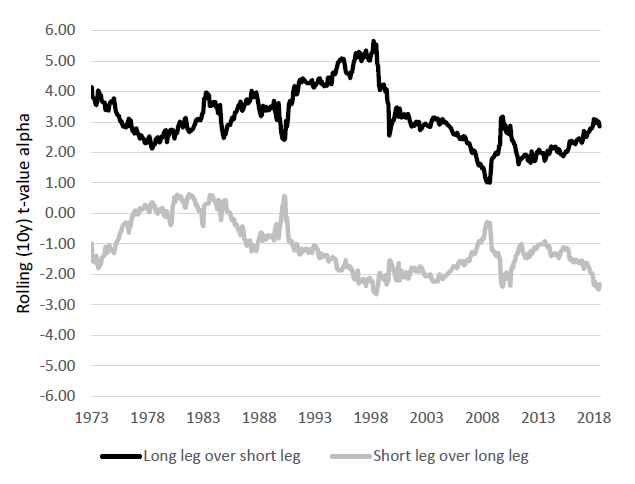 |
 |
References
-
Blitz, David and Baltussen, Guido and van Vliet, Pim, When Equity Factors Drop Their Shorts (November 27, 2019). Financial Analysts Journal, forthcoming, Available at SSRN: https://ssrn.com/abstract=3493305 or http://dx.doi.org/10.2139/ssrn.3493305 ↩︎
-
Hanauer, Matthias Xaver and Windmüller, Steffen, Enhanced Momentum Strategies (August 07, 2020). Available at SSRN: https://ssrn.com/abstract=3437919 or http://dx.doi.org/10.2139/ssrn.3437919 ↩︎